
Here is a quick and easy way to see all the frame rates (or whatever data you are interested in) over a specified period of time.
In the Settings –> Data Output tab, click the check box in the Data Graph Window column: 
Now begin your flight.
When you want to see the data, type [CTRL] G on Windows and Linux and [CMD] G on a Mac and a Data Output Graph window appears:
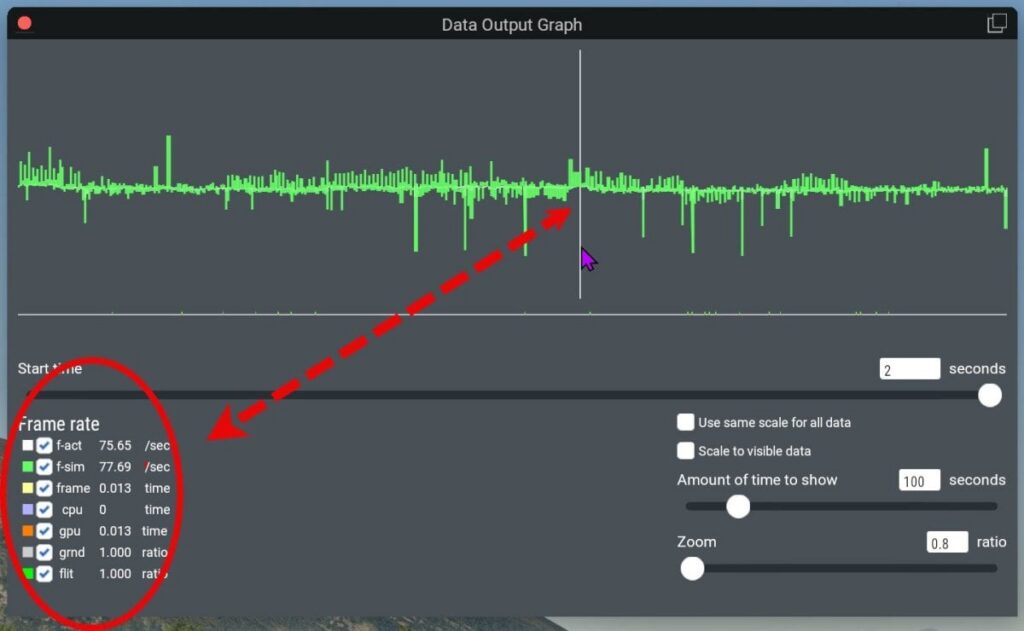
In this window you can adjust the time taken for the graph to travel from one side to the other side of the window. Now move the cursor above the green graph and a vertical white line appears at the cursor position and the precise frame rate (and related times) appears in the Frame rate list on the left. Once the graph reaches the right hand side of the screen (the specified “Amount of time to show”), The graph simply scrolls. Pressing pause [P] stops the simulation and the graph and will allow you to read the exact data value that appears below the vertical white line.
An added bonus is that the window can be moved to a second monitor where the graph can be enlarged and can be displayed while you fly without obscuring the main flying monitor.