Posted on

CPU or GPU – Identifying the Hardware Bottleneck

Before setting up your X-Plane hardware for maximum performance, you want to ascertain whether the CPU and the GPU are roughly in balance. This will warn you whether you seriously need to consider upgrading to a better CPU or a better GPU before you go to all the trouble of running further tests and setting your whole system up carefully.

In the X-Plane’s settings screen, click on the Data Output tab. Tick the Frame rate checkbox. Start X-Plane
CPU Time Vs GPU Time.jpg

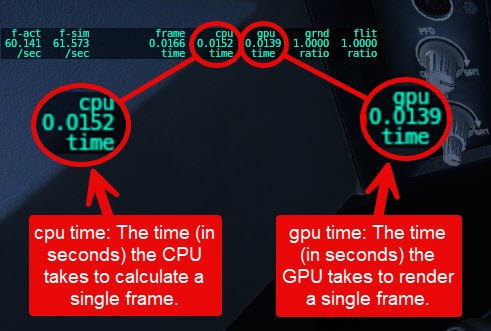
With X-Plane running, compare the time the CPU takes to calculate a frame with the time the GPU takes to render that frame. Ideally, with perfectly balanced hardware, the two numbers should be identical but in actual practice, as you move the view, the two numbers will change. They will also change if you change the graphics settings. The main point here, however, is that if the numbers are reasonably similar, then your hardware is balanced. If one or the other is very much larger, it’s an indication the one is being maxed out while the other is just coasting along. Also if one value is constant while the other fluctuates with different views, then you know that either the GPU or the CPU is saturated and can’t keep up with the other.

For more information on this subject @Janov wrote an excellent post about this bottleneck on X-Plane.org

on X-Plane.org

Posted on

Record your Framerate

It’s all very well to to watch “f-act” in the screen frame-rate display as you fly. However it’s constantly changing. The best way to study your frame rate is to have a list of all these figures and maybe put them into a spreadsheet. You can easily do this by clicking on the Developer menu pull-down option and click on Show FPS Test recorder.

Test recorder.jpg

In the window that pops up you can click “Start recording” at any point during your flight and when you have recorded enough, click Stop recording. X-Plane then writes out a file showing the stats:

Test recorder result.jpg

You can find this file in the …X-Plane 12\Output\replays folder as a .fps file. Although it has a .fps extension, its a text file readable in any text editor. It’s laid out as a CSV file [comma-separated values file]  with spaces instead of commas so it’s easy to import into a spreadsheet.

Of course, you can always set the data output to record to a file as well as show on the screen, but this is often overkill since the entire flight’s frame rate is recorded resulting in an enormous file:

Sisk recording.jpg
Posted on

An Easy View of Historical Frame Rates

Here is a quick and easy way to see all the frame rates (or whatever data you are interested in) over a specified period of time.
In the Settings –> Data Output tab, click the check box in the Data Graph Window column: Data Graph window settings.jpg

Now begin your flight.
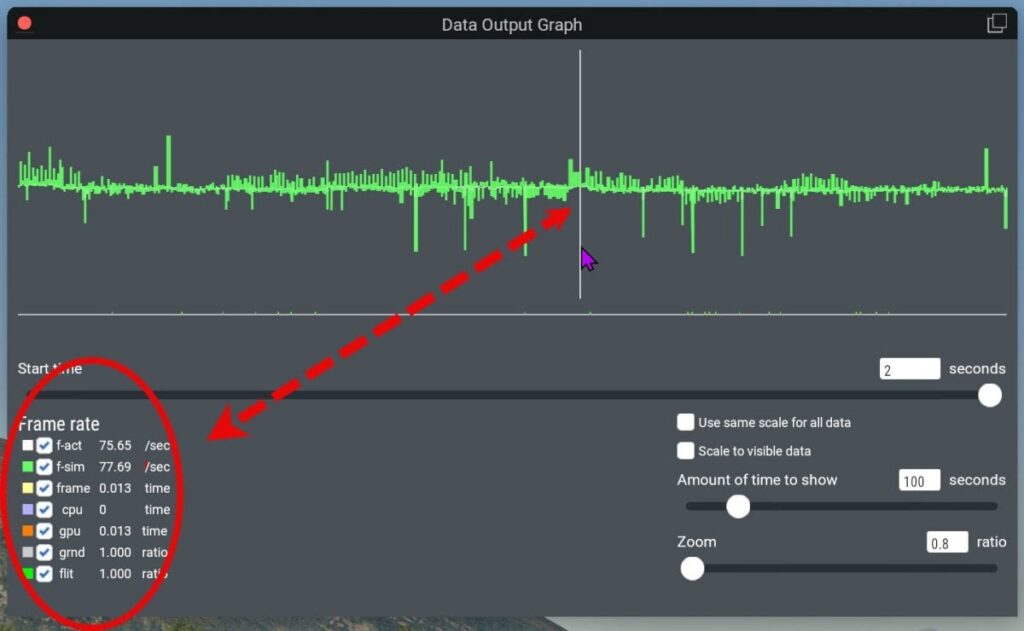
When you want to see the data, type [CTRL] G on Windows and Linux and [CMD] G on a Mac and a Data Output Graph window appears:

In this window you can adjust the time taken for the graph to travel from one side to the other side of the window. Now move the cursor above the green graph and a vertical white line appears at the cursor position and the precise frame rate (and related times) appears in the Frame rate list on the left. Once the graph reaches the right hand side of the screen (the specified “Amount of time to show”), The graph simply scrolls. Pressing pause [P] stops the simulation and the graph and will allow you to read the exact data value that appears below the vertical white line.
An added bonus is that the window can be moved to a second monitor where the graph can be enlarged and can be displayed while you fly without obscuring the main flying monitor.

Posted on

X-Plane Safe Mode

Did you know that X-Plane has a Safe Mode option?

If you hold down image.jpeg while clicking the X-Plane.exe start file, you get this screen (whether or not you crashed last flight):

image.jpeg

This safe mode allows you to start X-Plane using the Default rendering options rather than your carefully tweaked rendering options. If you click the “Use Default Rendering Options” button, X-Plane will load using the default graphics settings.
Because safe mode does not change your rendering settings, the next time X-Plane starts, it will use your custom settings again.

On purpose of this “safe mode” is to help get X-Plane started if an add-on that changes X-Plane’s visual graphics settings causes a crash.
The other purpose is to allow you to compare your customized setting experiments with the default values.

Note this does not have any effect on the graphics driver settings you may have customized. Safe mode only affects the values set in X-Plane’s Settings –> Graphics page

Posted on

Shader cache – the real story

With depressing regularity someone will suggest that deleting the shader cache is a cure-all for graphics anomalies and should be a regular part of X-Plane housekeeping.

The short answer is “No it isn’t” and “No it shouldn’t be”.
Don’t bother to delete the shader cache – it won’t fix anything

The long answer is buried in a long-buried discussion conducted over a year ago on X-Plane.org. Go to this link – it’s page 3 of a long thread about Public Beta 12.2.0-b4. Read the explanations (various posts) written by @JustSid (Sidney Just – Laminar’s graphics technical guru) – who is really the ultimate authority on this matter.